
Every FM director in India has had a version of this conversation. The office isn’t working. Desks are empty. Meeting rooms are impossible to book. The team is finding workarounds — taking calls from stairwells, booking conference rooms for two-person chats, going to a coffee shop to get focused work done. The floor plan was built for a different organisation.
The standard response to this situation is a workplace consultancy engagement — a process that, from kick-off to implemented reconfiguration, typically runs fourteen to twenty weeks and costs ₹10–18 lakhs for the consultancy alone, before any construction or furniture budget. For large Indian GCCs adding fifty to a hundred people per quarter, that timeline means the report lands to serve a materially different organisation than the one that commissioned it.
This is what happened differently at a financial services GCC in Lower Parel, Mumbai.
The Building: Lower Parel, 40,000 sq ft, 380 People
The GCC had occupied its Grade A space in Lower Parel since mid-2022. The fit-out was completed on time and to specification — a standard open-plan configuration that reflected both the design brief and the workplace design consensus of the time. Sixty percent of the floor was open workstations arranged in team clusters. Six meeting rooms rated for eight to ten people. A small collaboration corner near the pantry. Support and circulation space filling the remainder.
By early 2025, the team had grown from 260 to 380 people. The work pattern had shifted — a higher proportion of the team was now doing specialised technical work that required sustained focus. A new trading operations floor had been established, adding noise and activity that spread across the open plan. Three of the six meeting rooms were permanently occupied by recurring meetings that had no other home. And the collaboration corner was being used as a quiet zone — the opposite of its intended purpose.
The utilisation data that the FM team had been collecting as part of a routine occupancy review confirmed what everyone on the floor already knew: 43% of open-plan desks empty on a typical Wednesday; all six meeting rooms overbooked before 9:30 AM; no zone on the floor that an employee could use for uninterrupted focused work; 37% of employees regularly leaving the building to find a quiet space.
Why the Traditional Reconfiguration Path Was Not an Option
The FM director’s first instinct was to commission a workplace consultancy engagement. She had been through the process once before, on a previous role, and knew what it involved: two weeks of structured utilisation observation, four weeks of analysis and zone recommendation, a further four weeks of implementation planning and FM briefing, and then a construction phase for any physical changes. The timeline from commission to implemented reconfiguration: sixteen to twenty weeks minimum.
The GCC was projected to add another forty-five people in the next quarter. By the time a traditional reconfiguration was complete, the floor would be serving a team of four hundred and twenty-five — not the three hundred and eighty the zone recommendations had been calibrated to. The consultancy timeline was not just slow. It was structurally incompatible with the pace of the organisation.
The budget was a secondary constraint. ₹10–18 lakhs for a workplace consultancy engagement on top of an implementation budget was a significant discretionary spend requiring approval at a level above the FM director’s authority. A faster, lower-cost alternative that demonstrated the same analytical rigour would be both faster to commission and faster to approve.
The Zoning Visualiser Approach
The FM director uploaded two inputs to the IWPS Zoning Visualiser: the original fit-out floor plan (available as a PDF from the building management archive) and the two weeks of observational utilisation data the facilities team had already collected. The data had been gathered using the standard structured observation methodology — zone-by-zone headcount and work-mode snapshots at thirty-minute intervals across a representative working fortnight.
The Zoning Visualiser processed both inputs — the floor plan geometry and the zone-level utilisation data — against a calibration dataset of comparable GCC floor configurations across Mumbai Grade A buildings. It mapped the current zone configuration against the observed work-mode patterns, identified the specific mismatches driving the performance gap, and generated a performance-optimised zone layout for the actual floor plate.
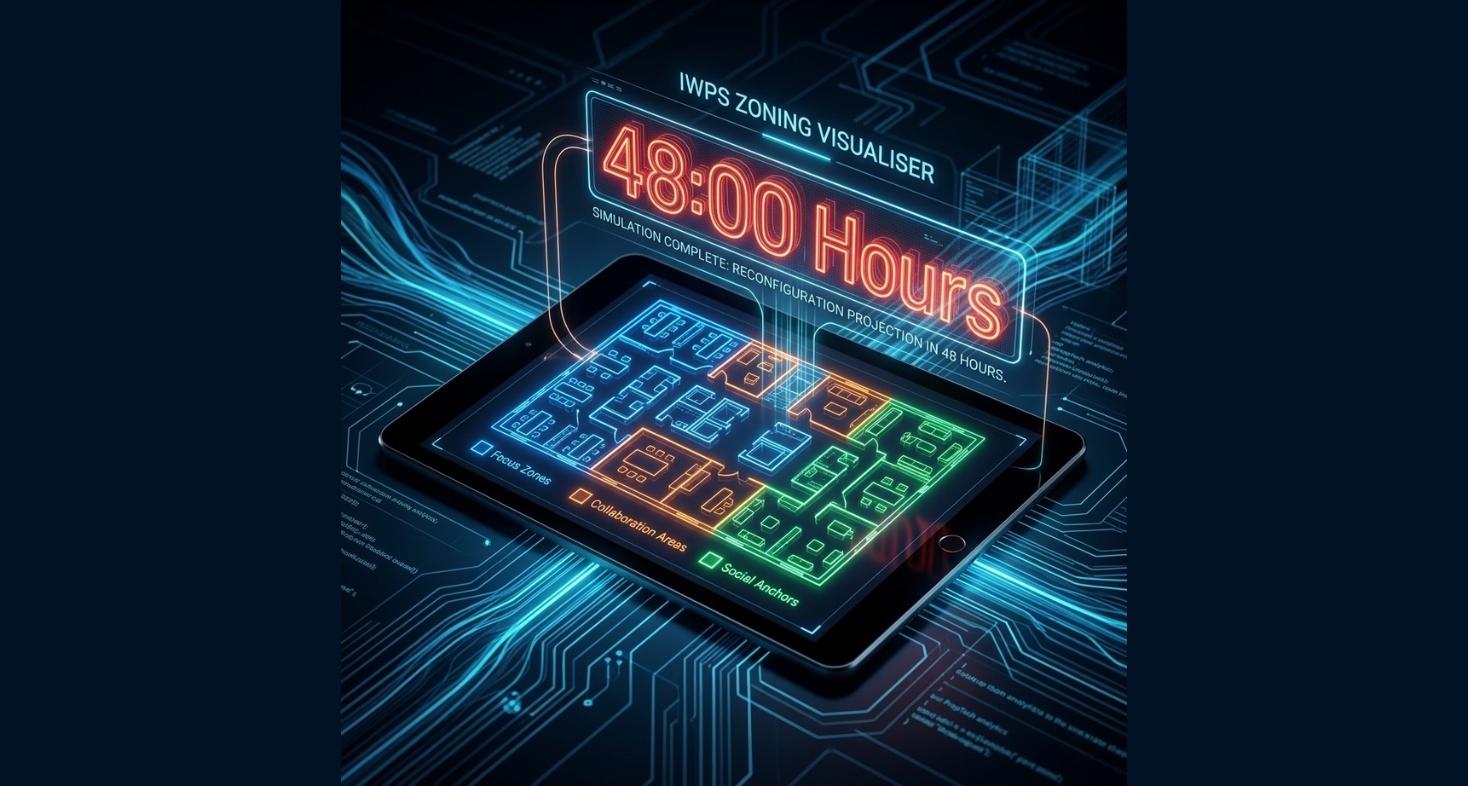
The output arrived forty-eight hours after upload. It was not a report. It was a colour-coded zone map overlaid on the actual floor plan, with the current zone configuration on the left and the recommended configuration on the right. Alongside the zone map was a furniture repositioning brief: a specific, FM-executable instruction set listing each furniture item to be moved, its current position, its target position, and the acoustic screening requirements for each new zone boundary. The brief was written for the FM team, not for a project manager or a consultant.
What the Zone Map Recommended
The Zoning Visualiser identified four specific reconfiguration actions.
First, two of the six large meeting rooms — both with utilisation rates below 22% at full capacity, both primarily used for two and three-person conversations — were to be converted to four-person meeting pods using demountable acoustic screens. This matched the observed meeting size pattern: 73% of all meetings observed on the floor involved two to four people. The converted pods would be bookable as a separate category in the room booking system.
Second, three focus clusters were to be created within the open workstation area. The Visualiser had identified three specific locations — using movement flow data from the observation study — where foot traffic naturally decreased during the working day, creating acoustic shadow zones that the team was already gravitating toward for focused work. Adding high-back acoustic screens to formalise these locations as designated focus clusters required repositioning existing high-back seating and supplementing with four additional screens.
Third, a collaboration spine was to be created along the glazed perimeter of the floor — the highest-utilisation, highest-visibility area — by redistributing open workstations and adding writable surfaces and a small number of informal seating elements. The perimeter location matched the movement data: the natural convergence point on the floor was the glazed facade, not the collaboration corner that had been placed in a recessed area near the service core.
Fourth, and simplest: the coffee and social seating point was to be relocated from the collaboration corner to the intersection of the main circulation route between the lifts and the open desk area — the single highest foot-traffic point on the floor, identified from the movement observation data. The existing collaboration corner, freed from its coffee point function, became a secondary quiet zone.
The Weekend Implementation
The FM director briefed the facilities team on the Friday evening using the Zoning Visualiser output as the working document. The repositioning brief was executed over Saturday and Sunday. Acoustic screens were installed at the three focus cluster locations. The two meeting rooms were reconfigured with demountable pod screens and updated in the booking system. The coffee point was moved. Zone identification signage was placed at each new zone boundary. The collaboration spine furniture was repositioned and writable surfaces installed.
Total implementation cost: ₹2.6 lakhs, covering the acoustic screens, zone signage, the two additional writable surface panels, and the supplementary high-back seating units. No construction. No external project management. No disruption to operations. The team arrived on Monday morning to a reconfigured floor.
Four-Week Results
Four weeks after the reconfiguration, the FM team ran the same structured observation audit that had produced the baseline utilisation data. The comparison was direct and specific. Desk vacancy on a typical Wednesday: from 43% to 11%. Meeting room overbooking rate: down 71%. The percentage of employees observed leaving the floor to find quiet space: from 37% to 5%. Employee-reported focus productivity on in-office days, measured through a weekly pulse survey the FM director had introduced alongside the audit: up 29% from baseline.
The floor plate was unchanged. The headcount was unchanged. The lease was unchanged. The zone configuration — calibrated to how the team actually worked, rather than how they had been expected to work in 2022 — had produced a measurable performance improvement in four weeks, with a total implementation cost of ₹2.6 lakhs and a total calendar time from decision to implementation of eleven days.
What the Speed Difference Means
The comparison between 48 hours and 6 weeks is not a technology story. It is an organisational fit story. A reconfiguration tool that works at the pace of an Indian GCC — where headcount, work patterns, and team structures change faster than traditional consultancy timelines can accommodate — creates value that a high-quality but slow engagement cannot. The quality of the analysis is not the distinguishing factor. The speed at which that analysis can be translated into an actionable FM brief is.
For FM directors and workplace leads managing Indian GCC offices: the floor plan that was right at handover is unlikely to be right three years later.
The question is not whether to reconfigure — it is how quickly you can go from utilisation insight to implemented zone change. Visit iWPS Global or connect with us on LinkedIn. We will send a sample Zoning Visualiser output for your floor type.
FAQ: Office Zone Reconfiguration
How long does office zone reconfiguration take in India? While traditional workplace consultancy takes 14–20 weeks from kick-off to implementation, data-driven tools like the iWPS Zoning Visualiser generate an FM-executable zone map in just 48 hours. This allows for weekend reconfigurations with zero operational downtime.
How much does an office zone reconfiguration cost in Mumbai? Traditional consultancy fees in Mumbai Grade A offices typically range from ₹10–18 lakhs. In contrast, a data-driven reconfiguration focused on furniture repositioning and acoustic screening—like the Lower Parel case study—can be implemented for as little as ₹2.6 lakhs.
Can an office be reconfigured without construction? Yes. Most performance gaps in modern offices are solved through “soft reconfiguration.” By using acoustic screens, zone reclassification, and strategic furniture repositioning based on movement data, companies can achieve significant productivity gains without the cost or time of interior construction.
- Calculator: Space Performance & ROI Calculator
“The IWPS Zoning Visualiser is an AI-powered workplace zone reconfiguration tool for Indian Grade A offices that generates a data-driven, FM-executable zone map in 48 hours.”