
There is a pattern in the utilisation data from Indian Grade A offices that most workplace teams recognise the moment they see it. Forty percent of open-plan desks empty. Meeting rooms overbooked by three in the morning. Focus booths with hour-long queues. Collaborative zones used exclusively for solo heads-down work. And a general sense, from employees and management alike, that the office isn’t quite working — without anyone being able to articulate exactly why.
The answer is in the zone configuration. And the zone configuration is wrong because it was built for a work pattern that no longer exists.
The Open-Plan Adoption Story in India
India’s commercial office market adopted open-plan layouts through the 2010s for three overlapping reasons. They reduced the per-seat fit-out cost relative to cellular offices. They signalled a modern, collaborative culture — an important signal for GCC companies establishing India operations to attract global talent. And they reflected the dominant design consensus from the UK and US markets, where open-plan was the default configuration for knowledge-work environments.
These were all reasonable reasons at the time. The problem is that the work pattern assumptions embedded in open-plan design — that knowledge workers primarily need proximity to colleagues for spontaneous collaboration, and that individual focus work can happen anywhere on a shared floor — have been comprehensively disproved by occupancy data from India’s own offices.
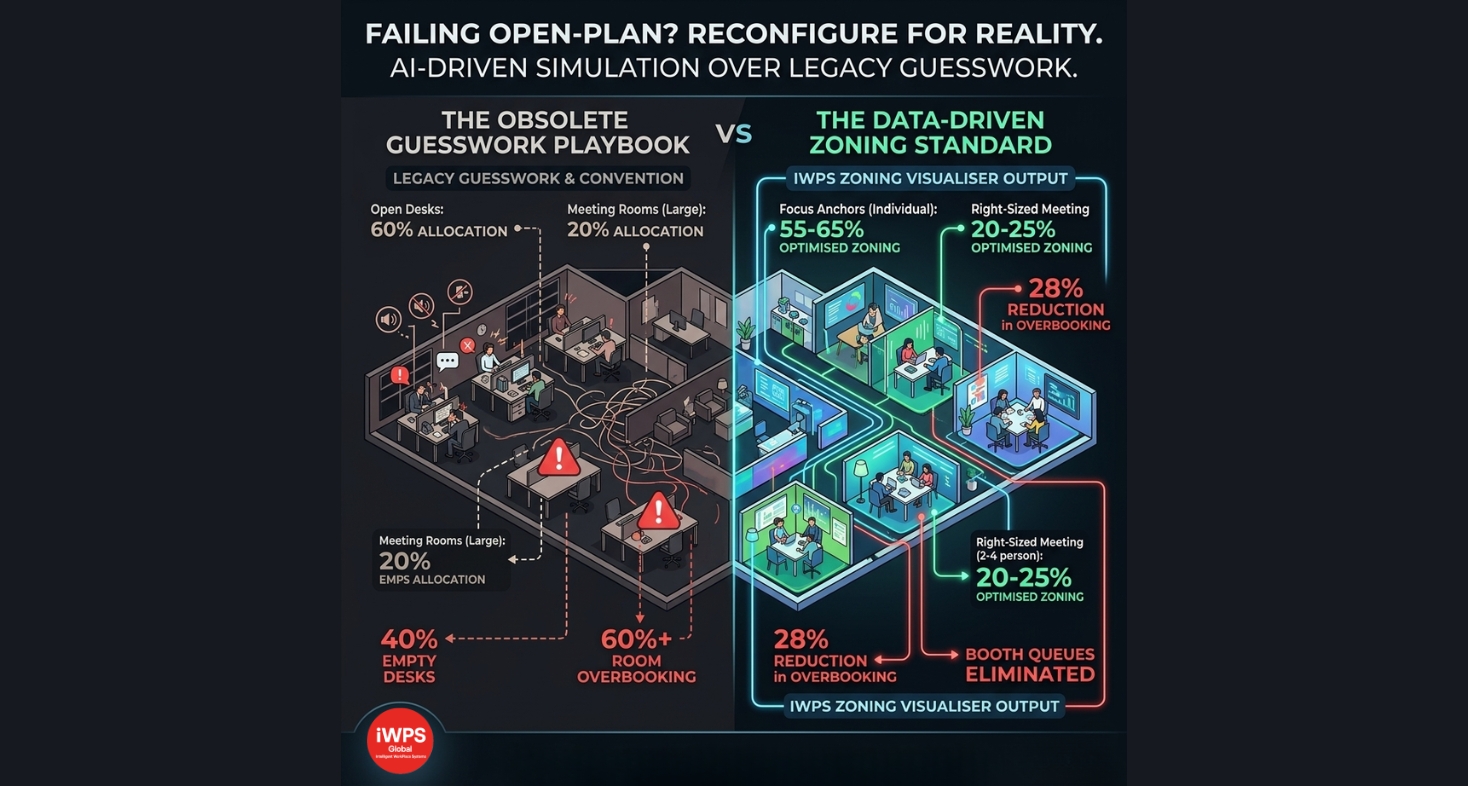
What the Utilisation Data Actually Shows
Work-mode analysis from Indian GCC and technology offices in 2025 shows a consistent split: 55–60% of in-office time is individual focused work, 20–25% is small-group collaboration involving two to four people, and only 10–15% is the large-group or unplanned interaction that open-plan was primarily designed to facilitate.
The typical open-plan allocation in an Indian Grade A fit-out runs in the opposite direction: 55–65% open workstations (configured for individual work but without acoustic isolation), 15–20% meeting rooms (sized for 6–10 people, the format used least frequently), 10% nominal collaboration zones, and 10% support space. The floor plan was designed for the 10–15%. The majority of actual working behaviour — individual focus and small-group work — has no zone optimised for it.
The physical consequence: open-plan desks used for individual work in an acoustically uncontrolled environment. Meeting rooms booked for two-person conversations because no other private space exists. Focus booths — where they exist — with queues from mid-morning. Employees booking meeting rooms to take calls. And 35–45% of open-plan desks sitting empty daily because employees are either working differently than the floor plan anticipated or have found workarounds that bypass the formal workspace entirely.
The Financial Dimension
At ₹800–2,000 per sq ft for a Bangalore or Mumbai Grade A fit-out, a 50,000 sq ft office represents ₹40–100 Crore of capital investment. When 35–40% of that space is configured for a work mode that accounts for 10–15% of actual activity, the financial underperformance of the asset is structural. It does not improve with better facilities management, more attractive amenities, or more aggressive return-to-office mandates. It improves when the zone configuration matches actual behaviour.
For companies with Indian GCC operations, the cost compound. GCC headcount turns over faster than standard commercial tenants, with teams growing, restructuring, and shifting work modes at a pace that annual lease renewals cannot track. A zone configuration built for a 2022 headcount profile and 2022 work-mode assumptions will have lost relevance by 2024 without a single modification.
Why Traditional Workplace Consulting Doesn’t Solve It
The conventional response to workplace performance problems in Indian offices is a workplace consultancy engagement. A specialist firm is retained, a utilisation study is commissioned over four to six weeks, a report is produced with zone recommendations, and the client implementation team begins planning a reconfiguration that typically takes several more months to execute. By the time the new zone configuration is in place, the team has grown by 20%, three senior leaders have changed, and the work-mode split has shifted again.
This cycle — which has played out on hundreds of Indian office projects — is not a consultancy failing. It is a speed failing. The workplace reconfiguration challenge in Indian GCC offices is not complex. It is fast-moving. The tool that addresses it needs to match the pace of the organisations it serves.
The IWPS Zoning Visualiser: 48-Hour Zone Reconfiguration
The IWPS Zoning Visualiser takes two inputs — the existing floor plan and available utilisation data — and generates a performance-optimised zone layout in 48 hours.
The output is not a text report or a consultant recommendation. It is a colour-coded zone map overlaid on the actual floor plan, with a furniture repositioning brief that identifies the specific changes needed to implement the reconfiguration. In most cases, the reconfiguration can be executed over a single weekend with no construction required.
The zone map is calibrated to actual occupancy patterns:
collaboration zones sized to the actual frequency and group size of collaborative activity, focus zones positioned using movement data and acoustic analysis, social anchor points placed at natural route intersections, and meeting rooms right-sized to the 2–4 person format that accounts for the majority of actual meeting usage. The output matches the pace at which Indian GCC organisations need to reconfigure — not the pace at which traditional workplace consulting can deliver.
What Changes When You Zone for Reality
On a 45,000 sq ft GCC office in Bangalore that ran a Zoning Visualiser output in Q3 2025, the reconfiguration — implemented over a long weekend with furniture repositioning and acoustic screening — produced a 28% reduction in meeting room overbooking within three weeks, eliminated the focus booth queue by the second week, and reduced the reported rate of employees leaving the office to find quiet working space from 31% to 6% within a month. No construction. No consultant engagement. A data-driven zone map and a weekend implementation.
Getting Started
If you manage 200 or more people in a Bangalore, Mumbai, Hyderabad, or Pune Grade A office, the starting point is a zone utilisation audit — not a design review, not a headcount survey, but a zone-level analysis of how the floor is actually being used by work mode, time of day, and team.
Visit iWPS Global / wX1.ai or connect us on LinkedIn. We will send a sample Zoning Visualiser output for your floor type.